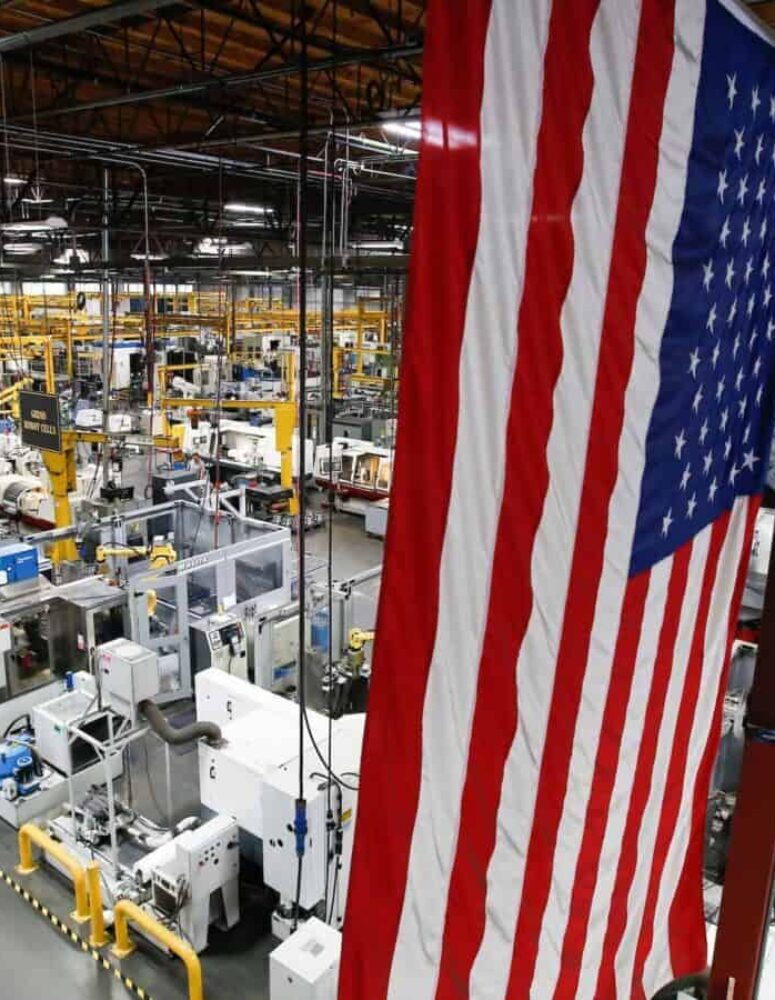
Manufacturing value-added output increased from $2.768 trillion in the second quarter to $2.809 trillion in the third quarter, an all-time high. Value-added output rose to new record levels in the third quarter for both durable goods (up from $1.503 trillion to $1.544 trillion) and nondurable goods (edging up from $1.2650 trillion to $1.2653 trillion). Manufacturing accounted for 10.9% of value-added output in the U.S. economy in the third quarter, down from 11.0% in the second quarter. With that said, real value-added output in the manufacturing sector inched up from $2.256 trillion in the second quarter to $2.259 trillion in the third quarter, as expressed in chained 2012 dollars. This remained lower than the record high in the fourth quarter of 2021, which was $2.325 trillion. Indeed, much of the gain in output was buoyed by higher prices. (Source: Bureau of Economic Analysis)

Facts About Manufacturing
Facts You Need to Know
The Top 18 Facts You Need to Know
Including indirect and induced impacts, for every $1.00 spent in manufacturing, there is a total impact of $2.60 to the overall U.S. economy. This figure represents one of the largest sectoral multipliers in the economy. In addition, for every one worker in manufacturing, 4.4 workers are added in the overall U.S. economy, including indirect and induced impacts, and for every $1.00 earned in direct labor income in the manufacturing sector, $3.75 in labor income earned is added to the overall U.S. economy. (Source: NAM calculations using 2021 IMPLAN data)
The majority of manufacturing firms in the United States are quite small. In 2019, there were 243,687 firms in the manufacturing sector, with all but 4,036 firms considered to be small (i.e., having fewer than 500 employees). In fact, 74.3% of these firms have fewer than 20 employees, and 87.7% have fewer than 50 employees. With that said, the bulk of employment comes from larger firms, with 57.9% of all employees in the sector working for firms with 500 or more employees. (Source: U.S. Census Bureau, Statistics of U.S. Businesses)
Manufacturing employment declined by 4,000 in February, decreasing for the first time since April 2021. Hiring in the nondurable goods sector also fell by 4,000 in February, with durable goods hiring flat for the month. Despite pulling back slightly, manufacturing employment has risen sharply over the past few years. There were 12,983,000 workers in February, just shy of January’s reading, which was the best since November 2008.
Meanwhile, nonfarm payroll employment rose by 311,000 in February, slowing from 504,000 in January but remaining strong. The labor force participation rate inched up from 62.4% in January to 62.5% in February, its best rate since March 2020. The participation rate continues to remain below pre-pandemic readings, however. The unemployment rate increased from 3.4% in January, the lowest rate since November 2008, to 3.6% in February. As such, the labor market continues to reflect overall strength. (Source: Bureau of Labor Statistics)
In 2021, manufacturing workers in the United States earned $95,990 on average, including pay and benefits. Workers in all private nonfarm industries earned $81,308 on average. Looking specifically at wages, average hourly earnings of production and nonsupervisory workers in manufacturing were $25.80 in February, up 5.0% from one year ago, continuing to be a highly elevated pace despite some easing from previous months in the year-over-year pace. For all manufacturing employees, average hourly earnings were $31.62 in February, up 3.7% from $30.48 one year earlier. (Sources: Bureau of Economic Analysis and Bureau of Labor Statistics)
Manufacturers have one of the highest percentages of workers who are eligible for health benefits provided by their employer. Indeed, 91% of manufacturing employees were eligible for health insurance benefits in 2022, according to the Kaiser Family Foundation. This is significantly higher than the 78% average for all firms. Of those who are eligible, 81% participate in their employer’s plans (i.e., the take-up rate). State and local government (89%), transportation, communications and utilities (85%) and finance (83%) had higher take-up rates in 2022. Meanwhile, the average annual cost of a family health care plan for a family of four in manufacturing was $21,852 in 2022. (Source: Kaiser Family Foundation)
Manufacturing reported 803,000 job openings in January. Over the past 12 months, job openings in the sector have averaged 844,750, remaining well above pre-pandemic levels. Manufacturers hired 417,000 workers in January, up from 405,000 in December, with increased nondurable goods hiring in the latest data but somewhat softer activity for durable goods firms. Total separations rose from 384,000 to 399,000 for the month. As a result, net hiring (or hiring minus separations) totaled 18,000 in January. Overall, net hiring has averaged 32,500 over the past 12 months, a solid reading.
In the larger economy, nonfarm business job openings slipped from 11,234,000 in December to 10,824,000 in January but remained quite elevated. Meanwhile, there were 5,694,000 unemployed Americans in January, which translated into 52.6 unemployed workers for every 100 job openings in the U.S. economy. As such, there continued to be more job openings than people actively looking for work. (Source: Bureau of Labor Statistics)
Over the next decade, 4 million manufacturing jobs will likely be needed, and 2.1 million are expected to go unfilled if we do not inspire more people to pursue modern manufacturing careers. Moreover, according to a recent report, the cost of those missing jobs could potentially total $1 trillion in 2030 alone. (Source: Deloitte and The Manufacturing Institute)
After weakening in 2019 and 2020 on trade policy and COVID-19 challenges, trade volumes rebounded in 2021, with U.S.-manufactured goods exports approaching 2018 levels. In 2021, manufacturers in the United States exported $1,399.17 billion, which was not far from the $1,399.75 billion seen in 2018 and up from $1,368.61 billion and $1,171.46 billion in 2019 and 2020, respectively. Moreover, it was not far from the all-time high reached in 2014, which was $1,403.78 billion. Durable goods exports totaled $878.07 billion in 2021, up from $761.06 billion in 2020. This was down from the record pace set in 2018, however, which was $923.74 billion. At the same time, there were $521.10 billion in nondurable goods exports in 2021, a new record and up from $410.40 billion in 2020. (Source: U.S. Commerce Department)
Manufactured goods exports have more than doubled over the past two decades. U.S.-manufactured goods exports totaled $622.31 billion in 2002, and in 2021, that figure is $1,399.17 billion, or 2.25 times larger. Nondurable goods exports have grown even faster over that time frame, up from $171.26 billion in 2002 to $521.10 in 2021, or 3.04 times larger. Meanwhile, durable goods exports have nearly doubled from $451.05 billion in 2002 to $878.07 billion to 2021. (Source: U.S. Commerce Department)
World trade in manufactured goods was $13.01 trillion in 2018, a new record, but pulled back in 2019 and 2020 amid trade policy and COVID-19 challenges. Total manufactured goods trade was $12.75 trillion and $12.13 trillion in 2019 and 2020, respectively. With that said, volumes have risen 2.59 times from the pace seen in 2000, which was $4.69 trillion. The U.S. share of world trade in manufactured goods was 7.5% in 2020. (Source: World Trade Organization)
World trade in manufactured goods has more than doubled between 2000 and 2017—from $4.8 trillion to $12.2 trillion. The U.S. share of world trade in manufactured goods has grown from 7.6% in 2002 to 8.7% in 2017. (Source: World Trade Organization)
Taken alone, manufacturing in the United States would be the eighth-largest economy in the world. With $2.24 trillion in value added from manufacturing in 2020, only seven other nations (including the U.S.) would rank higher in terms of their GDP. Those other nations with higher GDP in 2020 were (in order) the U.S., China, Japan, Germany, the United Kingdom, India and France. After manufacturing in the U.S., the next five economies would be Italy, Canada, South Korea, Russia and Brazil, in that order. (Source: Bureau of Economic Analysis, International Monetary Fund)
Foreign direct investment in U.S. manufacturing reached a new record level in 2020. Overall, foreign direct investment has jumped from $499.9 billion in 2005 to $1,886.8 billion in 2020, a new record. The manufacturing sector comprised 40.3% of total foreign direct investment in 2020, as expressed on a historical cost basis. These data should continue to grow over the coming years, with the sector increasingly more competitive globally and with more companies reevaluating their supply chain in the midst of current disruptions. (Source: Bureau of Economic Analysis)
U.S. affiliates of foreign multinational enterprises employed more than 2.8 million manufacturing workers in the United States in 2020, or roughly 21.8% of total employment in the sector. In 2020, the most recent year with data, manufacturing sectors with the largest employment from foreign multinationals included motor vehicles and parts (512,300), chemicals (420,300, including 221,300 in pharmaceuticals and medicines), food (345,000), machinery (239,200), other manufacturing (223,200) and computers and electronic products (203,400). Total compensation in the manufacturing sectors from these affiliates was $270.1 billion, and those entities spent $51.1 billion in research and development. (Source: Bureau of Economic Analysis)
Manufacturers in the United States perform 55.2% of all private-sector R&D in the nation, driving more innovation than any other sector. R&D in the manufacturing sector has risen from $132.5 billion in 2000 to $347.4 billion in 2021. In the most recent data, pharmaceuticals accounted for 34.1% of all manufacturing R&D, spending $118.4 billion in 2020. Computer and electronic products (15.5% of manufacturing R&D), semiconductor and other electronic components (14.4%) and motor vehicles and parts (8.0%) also contributed significantly to R&D spending in 2021. (Source: Bureau of Economic Analysis)
Manufacturers consume more than 30% of the nation’s energy consumption. Industrial users consumed 32.3 quadrillion Btu of energy in 2018, or 32.3% of the total. (Source: U.S. Energy Information Administration, Annual Energy Outlook 2019)
The cost of federal regulations falls disproportionately on manufacturers, particularly those that are smaller. Manufacturers pay $19,564 per employee on average to comply with federal regulations, or nearly double the $9,991 per employee costs borne by all firms as a whole. In addition, small manufacturers with fewer than 50 employees spend 2.5 times the amount of large manufacturers. Environmental regulations account for 90% of the difference in compliance costs between manufacturers and the average firm.